Key terms:
- Your class – The pupils in your class who took the assessment.
- All pupils (global) – Everyone who took the assessment, including pupils in your class and pupils from other classes and schools. For example, the global average is the average result for all pupils who took the assessment, including your class.
- Raw score – The number of marks a pupil achieved out of the total marks available, for example 24/40. This score is used to calculate the other results you see.
- Total assessment score – The total number of marks available in the assessment.
- Percentage score – A pupil’s raw score shown as a percentage of the total marks available. For example, 24 out of 40 is 60%. This gives you a quick view of their result, although it doesn’t show how their performance compares with other pupils.
- Average score – The mean raw score for a group, such as your class or all pupils who took the assessment.
- Standardised score – A score on a consistent scale that helps you compare performance fairly. See Standardised scores below for more information.
- Percentile rank – Shows how a pupil’s result compares with all pupils who took the assessment. For example, a pupil at the 73rd percentile scored the same as or higher than around 73% of pupils. The 50th percentile represents the middle of the group.
- Attainment band – A simple way of summarising a pupil’s attainment as below, at or beyond the expected standard. See Attainment bands below for more information.
Understanding your results tabs
Results
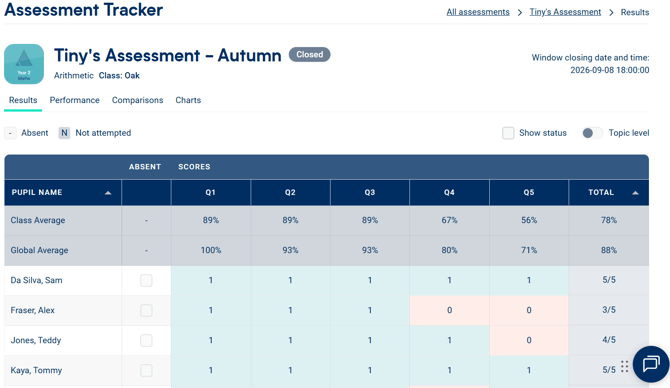
The Results tab is where you can enter and review your pupils’ raw scores. While the assessment window is open this is where you can edit scores directly in the grid. The options above it allow you to adjust what you see:
- Hide status – Hides the status markers to give you a simpler view of your results.
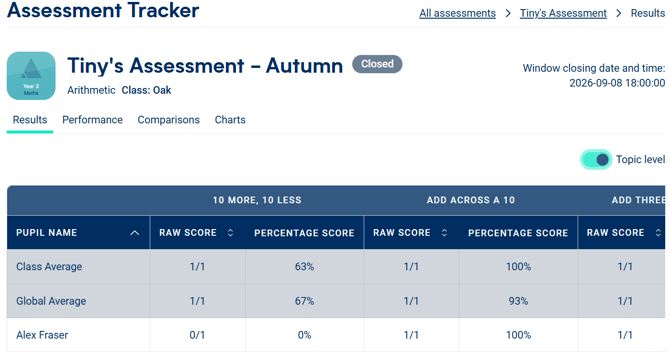
- Topic level – Available once the assessment window has closed. Switch to this view to explore each pupil’s raw score and percentage by topic. The Class Average and Global Average rows help you compare performance across each topic.
The key below the grid explains the status markers for Absent (–) and Not attempted (N).
Performance
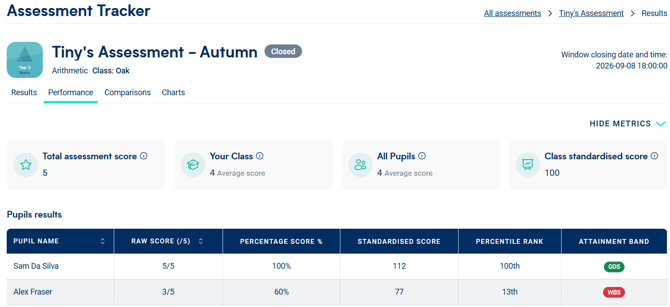
The Performance tab gives you an at-a-glance overview of how your class performed in the assessment. At the top, four summary tiles show:
- Total assessment score – The total number of marks available.
- Your class average score – The average score for pupils in your class who took the assessment.
- All pupils average score – The average score for all pupils who took the assessment, including your class.
- Class standardised score – The average standardised score for your class.
Below the summary, you can explore each pupil’s raw score, percentage score, standardised score, percentile rank and attainment band. If a result isn’t available, you’ll see a dash (–).
Comparisons
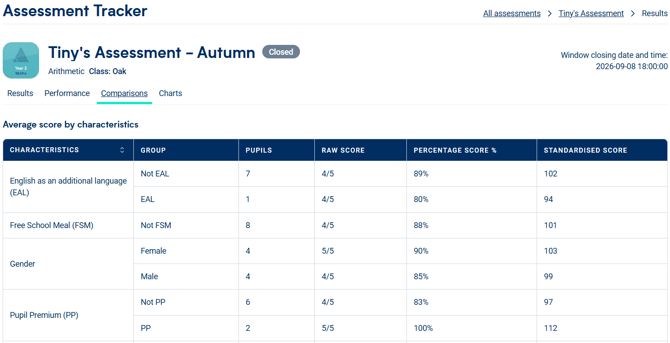
The Comparisons tab helps you explore how different groups of pupils performed in the assessment. Under Average score by characteristics, you can view the number of pupils and the average raw, percentage and standardised scores for groups based on:
-
Gender – Male and Female
-
SEN – Special educational needs status
-
Pupil Premium (PP)
-
English as an additional language (EAL)
-
Free School Meals (FSM)
At the bottom of the table, the Class average and Global average give you useful reference points for comparing each group with your whole class and all pupils who took the assessment.
Charts
The Charts tab brings your assessment results to life, helping you quickly spot patterns and explore performance across your class.
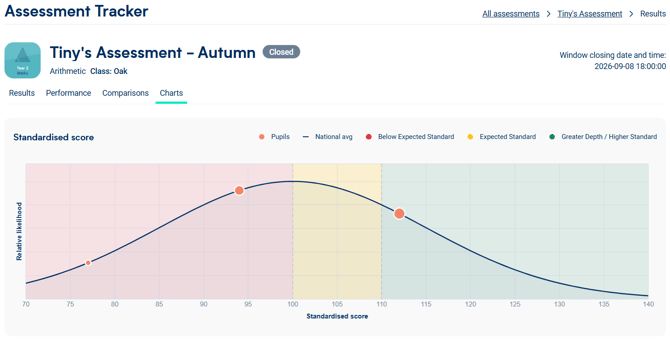
- Standardised score chart – See how your pupils’ standardised scores are distributed across the bell curve. It lets you see at a glance how your class is spread out and where each pupil sits relative to the middle. The shaded colours show the three attainment bands explained below.
- Average standardised score bar charts – Explore the average standardised scores for different pupil characteristic groups. A separate chart for each characteristic makes it easy to see and compare group performance.
Standardised scores explained
A standardised score helps put a pupil’s result into context. It converts raw scores onto a consistent scale, taking account of how pupils performed on that assessment. This makes it easier to understand a pupil’s performance and compare results across assessments.
On the standardised score scale:
Scores range from 70 to 140
100 is the average for all pupils who took the assessment
Scores above 100 are above the average, while scores below 100 are below the average
Because the average is set at 100, like in other widely used assessments, you can quickly see how a pupil performed in relation to the wider group. Small differences around 100, such as 99 and 101, should not be treated as significant as they indicate performance close to the average.
Attainment bands explained
An attainment band gives you an at-a-glance view of a pupil’s attainment in relation to the expected standard. This makes it easy to see the range of attainment across your class and identify pupils who may benefit from additional support or challenge.
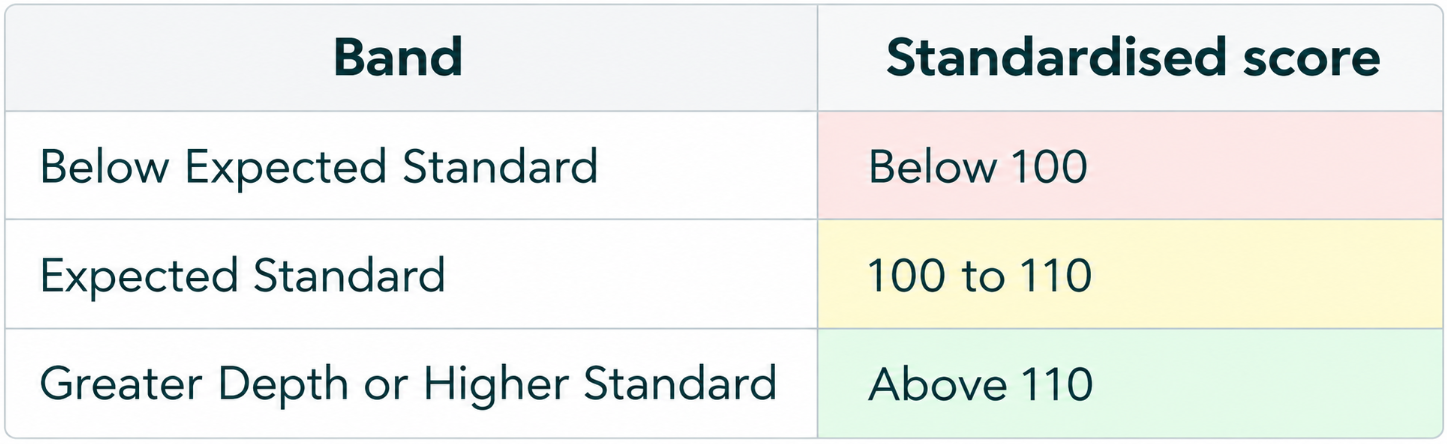
The bands align with the Department for Education’s teacher assessment framework, reflecting the standards used for statutory teacher assessment.
On the Charts tab, the standardised score curve is divided into three shaded attainment bands: